Tutorial
This Curveball tutorial walks through loading, processing, and analysing a read growth curve dataset.
About this tutorial
There is no better way to learn how to use a new tool than to see it applied in a real world situation. This tutorial will explain the workings of most of Curveball in the context of analysing a real growth curve dataset.
The data will be using is an Excel file (Tecan_280715.xlsx),
the result of me growing two bacteria strains (DH5α, denoted by G and TG1, denoted by R)
in a 96-well plate (Fig. 1) inside a Tecan Infinity plate reader over 17 hours at the Berman Lab in Tel-Aviv University.

Fig. 1 Plate template for the Tecan_280715 experiment, generated from the G-RG-R.csv plate template file. Green is for DH5α; Red is for TG1; Blue is for wells with both strains; White is for blank wells.
This tutorial assumes you are comfortable in the command line, but does not assume any prior experience doing data processing or analysis or with Python programming.
To follow the tutorial, go ahead and open a command line window (or a terminal).
Note
To open a command line (or terminal) in:
Windows: click the Start button, type cmd.exe and click Enter.
Linux: click Ctrl-T.
OS X: search for terminal in Spotlight.
Installing Curveball
Use the Installation instructions and check that Curveball was successfully installed:
>>> curveball --version
curveball, version x.x.x
where x.x.x will be replaced by the current version number (0.3.0).
Getting the data
The dataset we will be using is available online. Let’s start by creating a new folder for the tutorial. On Windows:
>>> mkdir curveball-tutorial
>>> cd curveball-tutorial
On Linux and OS X:
>>> mkdir curveball-tutorial
>>> cd curveball-tutorial
Now download the data file and the plate template file. Download the files using the links above and place themin the new folder. On Linux and OS X you can also download directly from the terminal:
>>> curl -L https://github.com/yoavram/curveball/raw/master/data/Tecan_280715.xlsx -o Tecan_280715.xlsx
>>> curl -L https://github.com/yoavram/curveball/raw/master/plate_templates/G-RG-R.csv -o G-RG-R.csv
Analysing the data
Now we can proceed to analyse the data using Curveball.
For this, we will use the curveball analyse command:
>>> curveball analyse Tecan_280715.xlsx --plate_file=G-RG-R.csv --plate_folder=. --ref_strain=G
This command will:
Load the data from the file
Fit growth models to the data separately for each strain
Select the best model fit for each strain
Use the best model fits to simulate a competition between the strains
Infer the fitness of the strains from the simulated competition
Note
Some interesting options we used:
--plate_file: sets the plate template file to beG-RG-R.csv(Fig. 1). Plate template files can be generated with Plato.--plate_folder: this tells Curveball where to find the plate file; by default it will look is a special plate templates folder.--ref_strain: sets the green strain (G) to be the reference strain when infering fitness; i.e., the fitness ofGis set to 1 and other strains are compared to it.
It will result in the creation of several figures (in .png files):
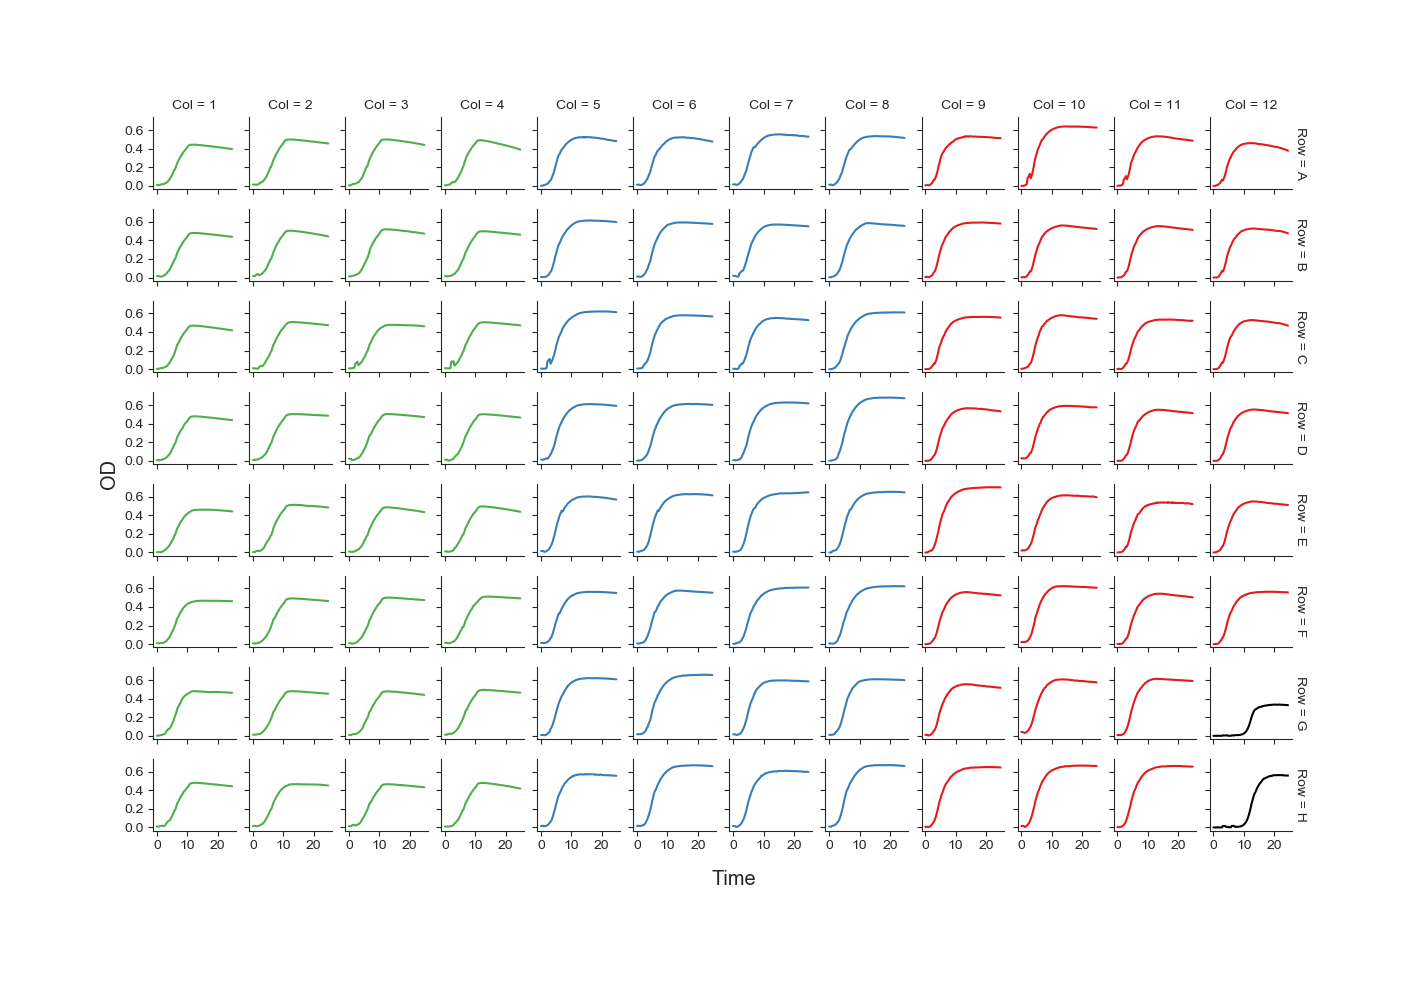
Fig. 2 showing the growth curve in each well of the plate.
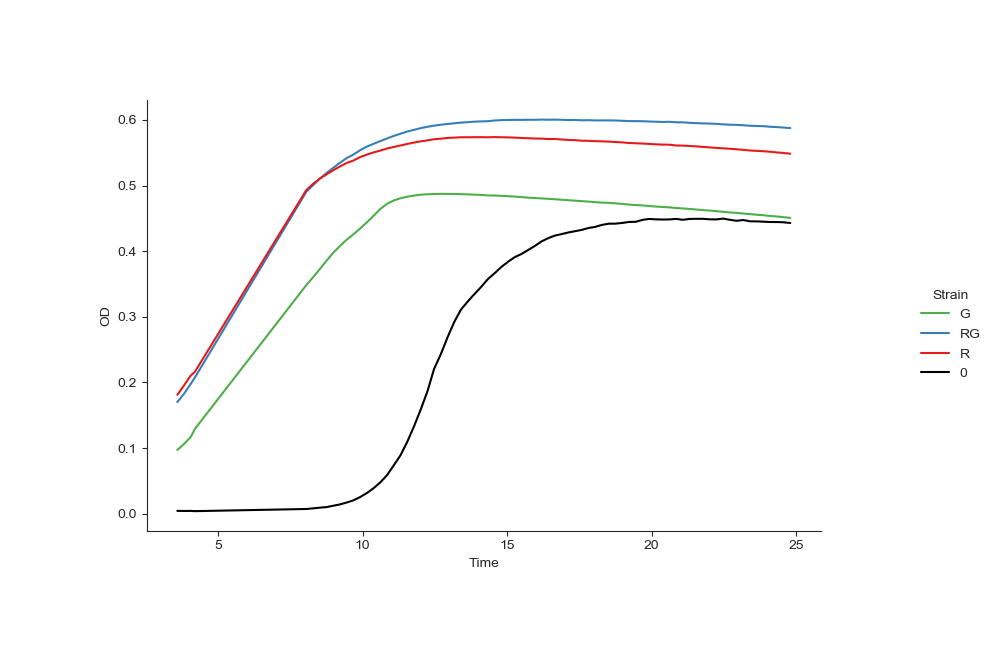
Fig. 3 showing the mean curve of each strain.
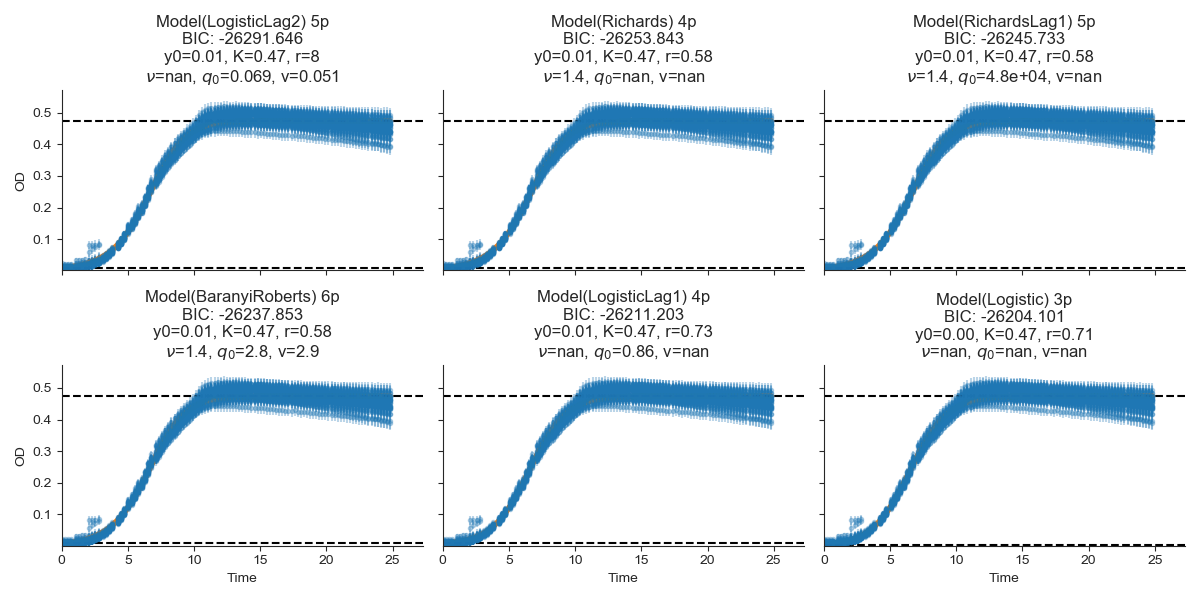
Fig. 4 showing the model fitting and selection plot of strain G.
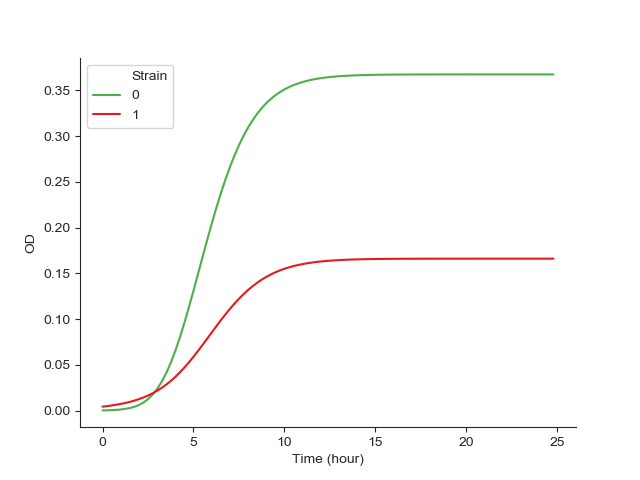
Fig. 5 showing the results of the simulated competition.
Also, it prints out a table that contains a summary for each strain, including all the growth parameters estimated by Curveball.
Here is the summary table:
folder |
filename |
strain |
model |
RSS |
RMSD |
NRMSD |
CV(RMSD) |
bic |
aic |
weighted_bic |
weighted_aic |
y0 |
K |
r |
nu |
q0 |
v |
has_lag |
has_nu |
max_growth_rate |
min_doubling_time |
lag |
w |
Tecan_280715 |
G |
Model(LogisticLag2) |
1.2187286188089612 |
0.019136470752551777 |
0.036886028105060795 |
0.05343908578345019 |
-26291.645674466108 |
-26322.196308475814 |
0.9999999937062152 |
0.9999999995571651 |
0.008565293245519134 |
0.47371743081929507 |
7.998944938699157 |
1.0 |
0.06945804207482031 |
0.051183894074232406 |
True |
False |
0.5538840236634903 |
1.2659384384384382 |
3.722401599043521 |
1.0 |
|
Tecan_280715 |
RG |
Model(Richards) |
4.1905499814232785 |
0.035484921895335385 |
0.0521606985160987 |
0.07601379797158914 |
-22189.596640899745 |
-22214.03714810751 |
0.9826688410163795 |
0.6652188152055876 |
0.000255009367419623 |
0.5975987037891288 |
5.164766176596245 |
0.10000000779411342 |
0.0 |
0.0 |
False |
True |
1.280224962834649 |
0.2482232232232232 |
2.5289676352361146 |
1.9583045184157362 |
|
Tecan_280715 |
R |
Model(Richards) |
6.7131013521842196 |
0.04638572031107196 |
0.06607652469891913 |
0.10264813213756584 |
-19129.38262963534 |
-19153.564982758555 |
0.9821027383511832 |
0.6652406380254341 |
0.0003612338473291121 |
0.5658226989393149 |
3.875456411066013 |
0.15031959074180415 |
0.0 |
0.0 |
False |
True |
1.3430423294648992 |
0.2730455455455455 |
2.388766145688185 |
2.082707562400426 |
Note
We can run curveball again, this time with the -o summary.csv option,
which will cause this table to be saved to a file named summary.csv instead of printing to the command line.
Additional commands and options
Let’s see which commands and options curveball supports:
>>> curveball --help
Usage: curveball-script.py [OPTIONS] COMMAND [ARGS]...
.
Options:
  -v, --verbose / -V, --no-verbose
  -l, --plot / -L, --no-plot
  -p, --prompt / -P, --no-prompt
  --where                         prints the path where Curveball is installed
  --version                       Show the version and exit.
  --help                          Show this message and exit.
.
Commands:
  analyse  Analyse growth curves using Curveball.
  plate    Read and output a plate from a plate file.
We’ve already seen --version, --where, and now --help.
As for the other options:
--verboseallows us to get more information printed from curveball; this is useful for bug hunting when we don’t get the results we think we should get.--no-plotturns off plotting; no plot files will be created, so curveball will finish faster.--promptturns on prompting; curveball will ask for confirmation, for example, when choosing the plate template file.
We can also list the options each command, such as analyse and plate, can get:
>>> curveball analyse --help
Usage: curveball-script.py analyse [OPTIONS] PATH
.
  Analyse growth curves using Curveball. Outputs estimated growth traits and
  fitness of all strains in all files in folder PATH or matching the pattern
  PATH.
.
Options:
  --max_time FLOAT            omit data after max_time hours
  --ref_strain TEXT           reference strain for competitions
  --blank_strain TEXT         blank strain for background calibration
  -o, --output_file FILENAME  output csv file path
  --plate_file TEXT           plate templates csv file
  --plate_folder PATH         plate templates default folder
  --help                      Show this message and exit.
Getting help
Please don’t hesitate to contact me (Yoav Ram) with any questions, comments, or suggestions: